


How 2025's planned F1 points system stacks up against other eras
Formula 1’s mooted points system expansion to award points down to 12th place has split opinion, with those in favour heralding greater competition and those against fearing it dilutes the current structure. Here’s a dig into the numbers and how the proposal compares to other eras
For the first time since 2010, Formula 1 is debating whether to change its points system and expand it from rewarding the top 10 to the top 12. A giant void between the top five teams in the championship and the bottom five has made it very difficult for the latter group to score points, leaving three teams with nothing from the opening five races.
Among those teams, support has been relatively unanimous. RB team boss Laurent Mekies stated: "If you look at the level of competitiveness of the top five teams and the reliability level of the cars, it means that most of the race you're battling theoretically for zero points, and we don't think this is right.
"We also think it's more meritocratic because, if you score points up until P12, you will avoid the effect where if something completely stunning happens and somebody scores a P5 or P4 in the rain, it means the other guys can stay home for 10 races.
"It's ticking all the boxes with virtually no downside, so hopefully it will go through."
But support from outside has been mixed. Many have suggested that F1 should go further and reward all finishers, much like IndyCar does today, while others consider that the top 10 is already sufficient.
Sky Sports F1’s Martin Brundle tweeted: “Formula One world championship points must be hard won and treasured. Valued. Not some kind of lucky dip where everyone wins a prize.”
The first part of that assertion is fair, although the 2010 system already inflated the points to their current worth. But a lucky dip? Let’s challenge that supposition: would extending points to 12th make points a too-common commodity? Can we express that mathematically? How does it compare to past seasons in F1, and the reliance on reliability?
One thing that has often led to the rationale for awarding points to lower positions has been in relation to the number of finishers in a race. Reliability remained poor in F1 for a very long time, as there were no regulations that mandated a certain shelf-life for engine components and the like. As reliability improved, particularly as F1 hit the 21st century, the field spread in the constructors’ championship was smaller – and thus, smaller teams had a much-reduced chance of getting off the mark.

Max Verstappen leads the points regulars behind the safety car in China
Photo by: Mark Sutton
Here’s what we’re going to do to measure 2025’s projected points system against other eras, and determine once and for all if it is befitting of F1. Firstly, we’ll work out the average finishing rate for each season (excluding Indianapolis 500s). This will then be measured against the number of finishing positions on offer per race for a year – in 1950 it was five, and 10 in the current system - and expressed as a percentage. This tells us, for an average race of any given season, the percentage of cars who finish that are awarded points. For 2025, we’re using a top-12 points distribution from 2024’s results so far to note the change.
We’re then going to look at points distribution over a season. Calculating the standard deviation will show the spread of points and divergence from the mean. Given that we’re looking at how the 2024 field is split, we want to compare the “mean team” to those finishing in other seasons: in 2024, this would be a team that theoretically finishes 5.5th in the constructors’ championship. We’re going to normalise all of these results for a 16-race season, and we’ll only go back to 1991 in this section to cover three different points systems. Teams lower than 13th in the constructors’ championship that didn’t score will be discounted.
Once we have this, we’ll divide our standard deviation calculations by the mean to create a relative standard deviation [RSD]. This allows us to compare figures between seasons, as the standard deviation alone will be influenced by the points systems. The RSD figure is a percentage, so can be compared.
Larger field sizes also tend towards larger numbers of finishers, which explains the uptick in expected finishers in the 1970s as grid sizes grew versus the 1960s
Finally, we’ll divide our RSD by our average finishing race to boil everything down to one number. We’ll call this “mean score difficulty”, which basically denotes the likelihood of our ‘mean team’ achieving a) a respectable score and b) a score close to the teams either side of it (in 2024, that’s fifth and sixth).
There are further things to be aware of in our calculations. Our number of finishers varies with official records because we have applied a blanket 90% lap count to every season. Anyone who has failed to finish less than 90% of the laps will not be counted as a finisher, in line with current regulation Article 62.2 in the official F1 sporting regulations. The regulations have changed on this front over the years, so it makes sense to bring everything onto the same level. Sprint races are also not included and ancillary points, (for example, fastest laps) are also omitted.
To illustrate this, below is a graph of average finishers per race for every F1 season.
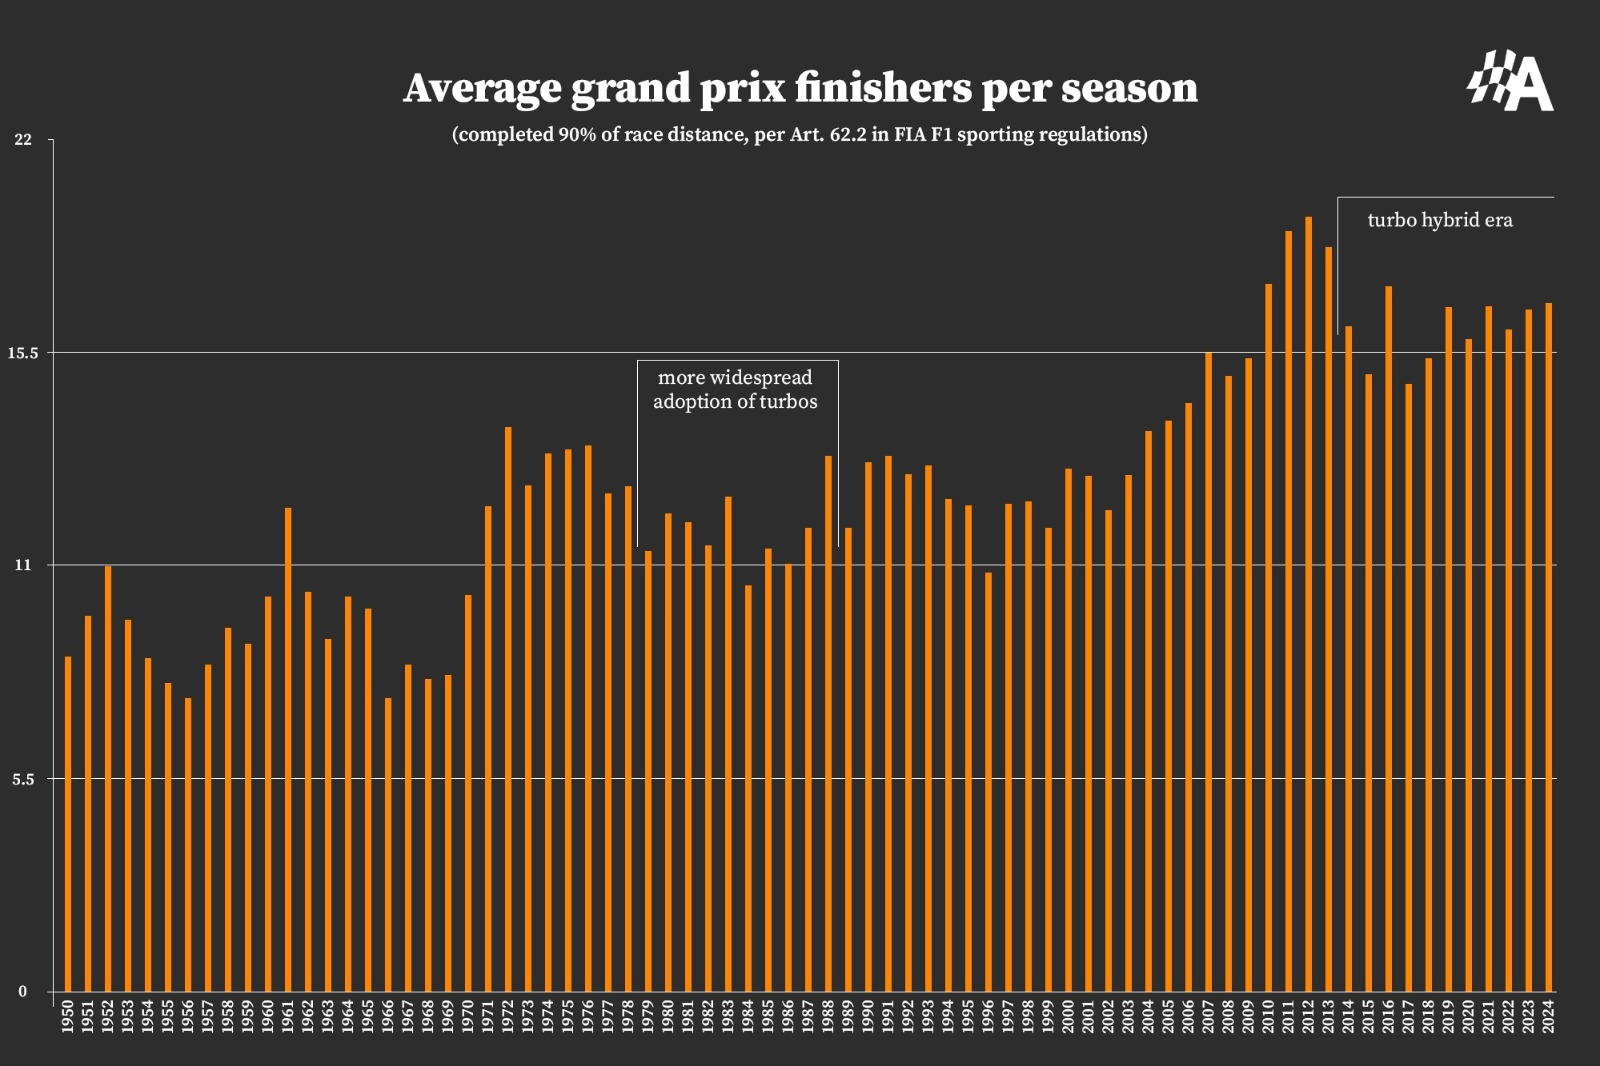
As the importance of reliability has stepped up across different F1 rules cycles, so has the number of finishers
Photo by: Autosport
This shows us the relative reliability rates of a season. It doesn’t necessarily show us anything beyond that, but seasons with higher levels of unreliability will suggest that there is the capacity for more surprise results. In the 1990s, a lot of teams beyond the front pack had to hope for races of attrition just to get a point on the board, or would design their cars to suit around two or three tracks of a similar characteristic, and hope for the best over the other circuits. That’s not really possible today, given modern-day ‘hyper-reliability’ thanks to the simulation tools in use.
Larger field sizes also tend towards larger numbers of finishers, which explains the uptick in expected finishers in the 1970s as grid sizes grew versus the 1960s.
We can work out the relationship of expected attrition with the scoring systems of each period. Dividing the number of scoring positions by the average finishers per race yields our percentage of classified cars expected to score per race. For argument’s sake, if all 20 cars finished a race in 2024, 50% of the field would score points. If all 22 cars finished a race in 1999 with a top-six scoring system, that’s a scant 27%. But that, in a time of greater unreliability, is unrealistic.
This graph shows how many cars who finished a grand prix could be expected to score in an average race for each season, showing the points systems’ correction for reliability.

In the mid-1960s the percentage of drivers scoring points for finishing shot up as unreliability and smaller grids took affect
Photo by: Autosport
Increasing the number of scorers to 12 ensures that, for an average race with 2.2 retirements, 67.4% of the finishers will score. That’s high, in contrast to the majority of modern seasons and 2023’s 56.7% figure, and does lend credence to Brundle’s suggestion that the expansion of the points devalues the point. But it’s not unprecedented: in the modern era, 2015 runs it close, as teams pushed their turbo-hybrid powertrains harder and upset reliability more than the conservative 2014 iterations.
And then there’s a smattering of seasons in the 1960s, where the scoring positions made up for over 70% of the average finishers. These seasons often had wild fluctuations in the number of entrants per race, sometimes as low as 13 or 14 cars on a regular basis. With retirements, it was very easy to score if one simply remained in the race. Surely that’s even more of a lucky dip: turn up, stick your hand in the barrel, and either pull out an engine failure or two points. It was very much luck of the draw in those cases.
As field sizes drew and reliability improved: most teams started to run time-tested Cosworth DFV engines and Hewland gearboxes, which reduced the variability of results. Thus, scoring became far more difficult – and it could even be argued that sticking with the top six for points was not fit for purpose by comparison to the seasons in the 1960s.
The relationship between finishers and the percentage of cars able to score points is an interesting one, but again, only tells a portion of the story. Currently, the other argument in the top-12 points system’s favour is in the variety of results. A very open chasm exists between the current five best teams and the bottom five, and those latter five are either waiting for unreliability to strike – or for Lance Stroll to have a nightmare.
Changing the points system for 2025 will effectively create a similar scoring distribution that was seen before the 2022 technical regulations were pressed into action
Many of the seasons we have explored have low percentages of expected scorers per race, but unreliability or fluctuations in performance have ensured that lower teams had opportunities to break into the points positions. We can work out the field spread based on points scored, which should demonstrate the distribution of points for a given season. We’ll use the seasons between 1991 and 2024 to reflect the progression of F1 over the common era, plus our theoretical 2025 based on 2024’s results.
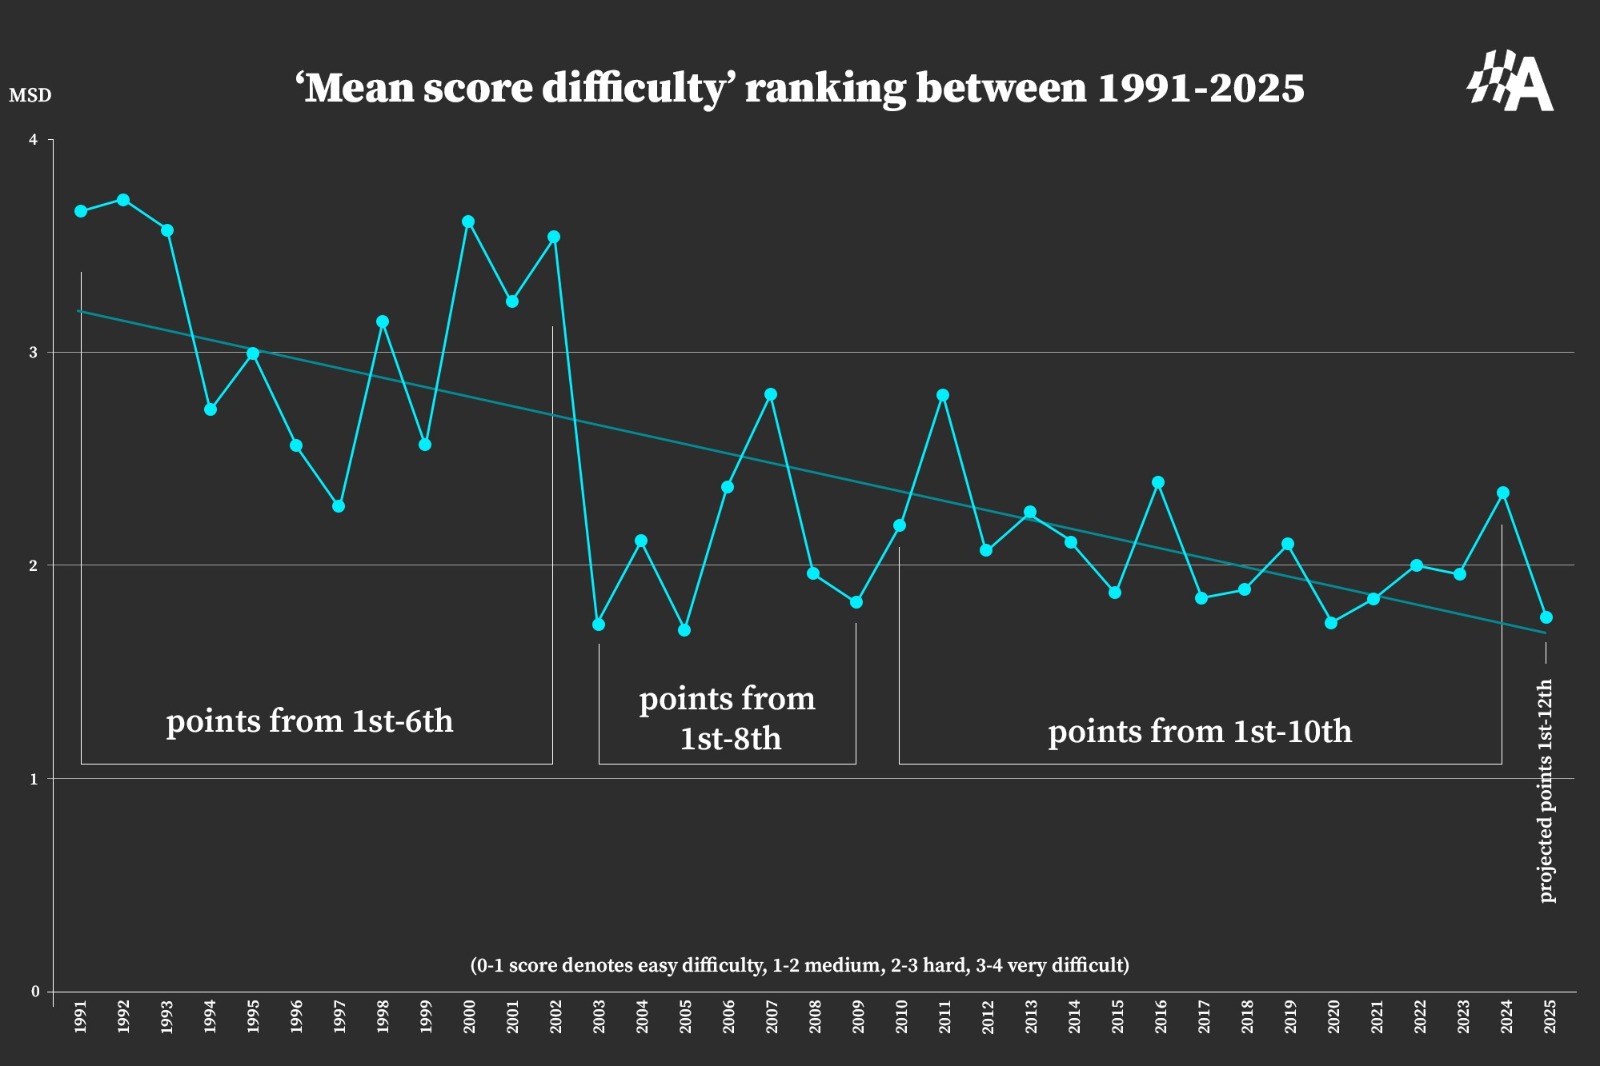
Now, all of the above calculations boil down to our Mean Score Difficulty graph. A higher MSD means that it’s more difficult for that theoretical 5.5th-placed team to break into the top 10 with regularity. Lower scores indicate that any team finishing in the middle of a 10-team constructors’ championship battle will be close on points with fifth and sixth places, and receive a better percentage of points on offer.
Hopefully, that makes sense – and here’s how to read those values. Anything below two suggests more midfield points, above two means increased difficulty, and three or above denotes a season where mid-pack teams score very little except in extreme cases. The latter scenario usually means that the top teams have hoovered up a massive percentage of points, and the other teams are scrabbling around for scraps.
Overall all teams have been able to score points more frequently since the 1990s
Photo by: Autosport
Here’s where we’re at: 2024 currently sits at an MSD of 2.29, the highest value experienced since 2016. In that season, the points were heavily concentrated among the top three teams, who scored 77% of the available points that season. The apogee of our MSD ranking for the 2010 points system was experienced in 2011 at 2.74, where 79% of the points were shared between the top three teams. This also takes into account the bottom three teams who all shared no points that year, so there is a skew in the gap between the top and bottom halves of the field.
A relationship between the introduction of the 2022 technical regulations and the MSD is evident, in that points were less evenly distributed following the close of the 2021 season. 2020 and 2021 were, for the midfield teams at least, easier to rack up points due to the relative stability of rules and the nature of the races throughout. With 1.71 and 1.82 MSD scores in those seasons, points were much less concentrated between the top teams and thus the ‘mean team’ could achieve top-10 finishes with greater regularity. But this rose to 1.96 in 2022, dropped slightly to 1.93 in 2023, but currently stands at 2.29 thanks to the larger gap between the top and bottom five teams.
Changing the points standings to include the top 12 at this moment, when normalised for a comparative 16-race season, shows a return to the pre-2022 levels experienced with a 1.73 MSD score.
This is, in effect, very similar to that experienced in 2003 when the points were expanded to include the top eight teams. Where the 2003 system differs is that, because victories were only worth 10 points, the points were much more evenly distributed. Owing to the average of 59% of finishers scoring points for a given race, up from 2002’s 48%, the field was brought closer together in the championship stakes.
This offers an MSD score of 1.70, lower than the 2025 system-affected 2024 results, but not the lowest seen in the 21st century. This goes to 2005’s 1.67 score, a season in which midfield runners had a chance to attain points finishes with greater regularity. But this data is helped for two reasons: firstly, the United States Grand Prix debacle in which only six cars contested the race, and secondly BAR’s Imola disqualification and ban for a subsequent two races owing to its use of fuel as ballast. This ensured Red Bull and Sauber could get closer to the mean score, while Jordan and Minardi also enjoyed higher-than-expected points hauls from that season.
Prior to the ‘03 system, the 2000-2001-2002 seasons were incredibly difficult for the midfield teams to claim regular points; F1 cars were becoming more reliable and the top three teams collected over 80% of the available points in each of those seasons. 2000 was the most difficult among those three, yielding an MSD score of 3.51; case in point, Ferrari and McLaren scored 170 and 152 points respectively, while third-placed Williams scored just 36 – one more point than its 1999 haul that yielded fifth in the championship.
So what does this all actually mean? Is this the self-aggrandising wormhole of a madman, or are there tangible conclusions that can be drawn?

Despite close battles, midfield teams face difficulty in scoring points
Photo by: Mark Sutton / Motorsport Images
Changing the points system for 2025 will effectively create a similar scoring distribution that was seen before the 2022 technical regulations were pressed into action. It shows that, despite the impact of the cost cap and the new regulations, the distribution of points from a given grand prix weekend has favoured the top teams more, which denotes a shift in the overall competitiveness since the ground-effect revival was introduced.
In 2024, it has become far more difficult for the “mean team” to score, because the gap between fifth and sixth places in the constructors’ championship has grown considerably. Part of that has been due to Alpine’s drop in performance relative to the rest of the grid, effectively creating a two-tier system.
Expanding the points for 2025 addresses this to a degree, but it’s hard to escape Esteban Ocon’s point of view that it’s “a plaster on a big cut”. Given that the problems, however, are happening now – it's probably more pertinent to suggest that it’s an attempt to shut the stable door after the horse has bolted.
What does F1 need to reclaim its magic? More unpredictability. How do you achieve that? Make the cars harder to drive
Equally, it’s a tomorrow solution to a now problem. In 2025, things might magically close up, rendering the 2025 top-12 format useless. That mean score difficulty would plummet, theoretically dropping well below the 2003 or 2005 ease factor.
It is abundantly clear that, when F1 was running to a system of points only for the top six, it did not effectively reward the teams that were battling in the midfield and the MSD scores reflect this: instead, points were awarded based on reliability, or lack thereof, and more mistakes were generated through cars with considerably less downforce compared to today. That’s not something to perhaps glorify – and, rather, scoring points back then was more akin to “lucky dip”.
Variance in results back then was often down to the considerably larger gaps. Now, when you consider the supertime metric, Alpine sits last but is a scant 1.971% slower than the overall performance benchmark – slightly outside Alfa Romeo’s bottom-line pace of 1.709% from 2023 but lower than Williams’ 2.516% disadvantage from 2022. The field is closer together, yet the divide between the top and bottom halves on the grid is exacerbated by a dearth in variability of results.

Alpine might be the slowest team in 2024, but its chances of scoring points are higher than recent years' slowest teams as the pack has condensed
Photo by: Andy Hone / Motorsport Images
The notion of ‘waiting for other cars to retire’ has returned, like it was in the 1990s, and that’s not a particularly good place for F1 to be. It might be remembered more fondly were there a title battle to speak of, which saves some of the seasons with huge points differences between top and bottom teams (like 2000) from being forgotten, but this is not the case either.
What does F1 need to reclaim its magic? More unpredictability. How do you achieve that? Make the cars harder to drive. This could be done by reducing tyre width once more, developing less grippy tyres, and maybe even reducing the outright downforce.
Better yet, F1 can define a maximum downforce limit, open the rulebook up, and let the teams have at it. It offers the chance for different approaches but keeps the output in the same box.
For your ‘too lazy, didn’t read’ conclusion: expanding the points-paying positions will close the midfield on points and bring it to pre-2022 levels. It won’t be a ‘lucky dip’, but it’s a temporary solution to a problem that could have been avoided. We probably didn’t need a giant spreadsheet to tell us that...

Can a new system help the midfield teams?
Photo by: Zak Mauger / Motorsport Images


F1 Belgian GP: Verstappen quickest in FP1 over Hamilton

Aston Martin "flat out" on Hungary updates but has concerns over spare parts being ready

Bortoleto: F1 hasn't lost its 'magic'; drivers need to "turn the page" on 2026 complaints

Two (and a bit) years on: Red Bull's 2024 political ructions have had the opposite effect

Why Leclerc’s battle of the brakes has left him trailing his Ferrari team-mate

What's Racing Bulls doing that Red Bull isn't?

How F1's current aerodynamic battlegrounds are shaping up - and what's next in 2027

British Grand Prix Driver Ratings 2026

Honda selects Marini's crew chief for Quartararo's arrival

WRC Estonia: Pajari leads after Friday afternoon clean sweep

Hadjar set for Belgian GP grid penalty after F1 engine change

F1 Belgian GP: Verstappen quickest in FP1 over Hamilton
Subscribe and access Autosport.com with your ad-blocker.
From Formula 1 to MotoGP we report straight from the paddock because we love our sport, just like you. In order to keep delivering our expert journalism, our website uses advertising. Still, we want to give you the opportunity to enjoy an ad-free and tracker-free website and to continue using your adblocker.
Top Comments